Impervious Surface Growth in Cookeville and Algood (2008-2012)
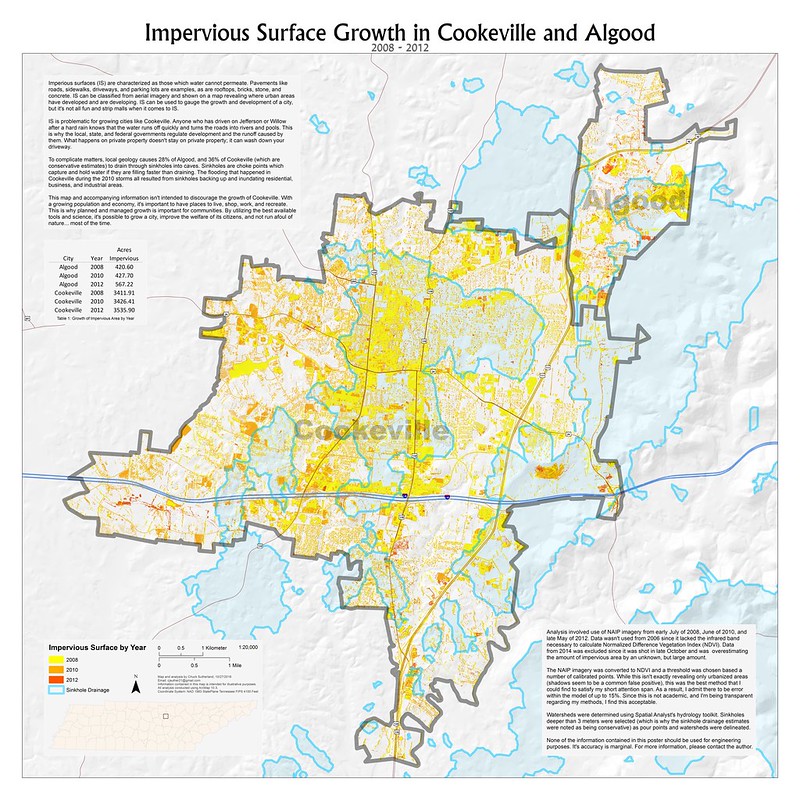
Imperious surfaces (IS) are characterized as those which
water cannot permeate. Pavements like roads, sidewalks, driveways, and parking
lots are examples, as are rooftops, bricks, stone, and concrete. IS can be
classified from aerial imagery and shown on a map revealing where urban areas
have developed and are developing. IS can be used to gauge the growth and
development of a city, but it's not all fun and strip malls when it comes to
IS.
IS is problematic for growing cities like Cookeville. Anyone who has driven on Jefferson or Willow after a hard rain knows that the water runs off quickly and turns the roads into rivers and pools. This is why the local, state, and federal governments regulate development and the runoff caused by them. What happens on private property doesn't stay on private property; it can wash down your driveway.
To complicate matters, local geology causes 28% of Algood, and 36% of Cookeville (which are conservative estimates) to drain through sinkholes into caves. Sinkholes are choke points which capture and hold water if they are filling faster than draining. The flooding that happened in Cookeville during the 2010 storms all resulted from sinkholes backing up and inundating residential, business, and industrial areas.
This map and accompanying information isn't intended to discourage the growth of Cookeville. With a growing population and economy, it's important to have places to live, shop, work, and recreate. This is why planned and managed growth is important for communities. By utilizing the best available tools and science, it's possible to grow a city, improve the welfare of its citizens, and not run afoul of nature... most of the time.
Analysis involved use of NAIP imagery from early July of
2008, June of 2010, and late May of 2012. Data wasn't used from 2006 since it
lacked the infrared band necessary to calculate Normalized Difference
Vegetation Index (NDVI). Data from 2014 was excluded since it was shot in late
October and was overestimating the amount of impervious area by an unknown, but
large amount.
The NAIP imagery was converted to NDVI and a threshold was chosen based a number of calibrated points. While this isn't exactly revealing only urbanized areas (shadows seem to be a common false positive), this was the best method that I could find to satisfy my short attention span. As a result, I admit there to be error within the model of up to 15%. Since this is not academic, and I'm being transparent regarding my methods, I find this acceptable.
Watersheds were determined using Spatial Analyst's hydrology toolkit. Sinkholes deeper than 3 meters were selected (which is why the sinkhole drainage estimates were noted as being conservative) as pour points and watersheds were delineated.


Comments