Delineating Sinkholes in GIS
A sinkhole, also known as a cenote, sink, sink-hole, swallet, swallow hole, or doline (the different terms for sinkholes are often used interchangeably), is a depression or hole in the ground caused by some form of natural collapse of the surface layer. Most are caused by karst processes – the chemical dissolution of carbonate rocks or suffosion processes. Sinkholes vary in size from 1 to 600 m (3.3 to 2,000 ft) both in diameter and depth, and vary in form from soil-lined bowls to bedrock-edged chasms. Sinkholes may form gradually or suddenly, and are found worldwide.
Above language is borrowed and slightly modified from the Wikipedia page for Sinkholes.
In order to have a tutorial showing my methods for delineating sinkholes, I'll need to define some vocabulary. This vocabulary isn't intended to replace any existing definitions so much as to clarify the context in which I'll be using them.
Sinkhole: A closed depression through which water can only escape through the subsurface whose area is defined as the upper most closed elevation contour of the feature.
Swallet: The point where water disappears into the subsurface. This could also be a cave entrance.
For the purpose of this tutorial I have chosen a portion of Warren County, Tennessee. If you would like to follow along, I've created an area of interest feature class and have set it to be the extent which I will be working in. This will only allow my commands to affect that region, thus saving time by not processing the entire county. The area is centered at 35.688251, -85.818811 (nearly at the confluence of Oakland Branch and Willow Branch) and my scale is set to 1:8000. LiDAR elevation data can be found here under the folder WarrenCo_2015_16_DEM_by_Tiles.
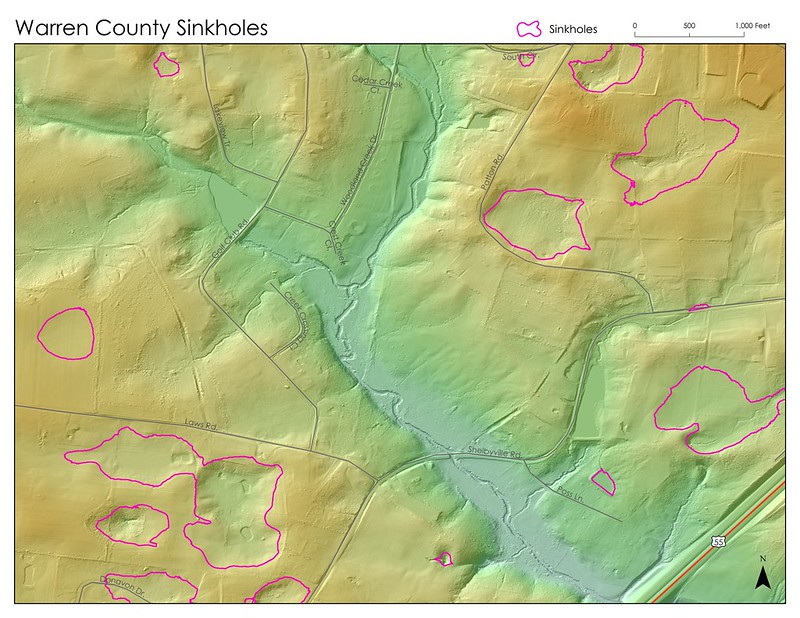
First, let's look at what our end goal is. We want to produce a map that looks like this.
Let's begin by loading the elevation into the data frame and using the fill tool on it.

We will get a filled sink version of the DEM.

Setup your raster calculation to look like this and execute the command.

Your output will be the difference between the filled and regular DEM. This layer is useful for a few steps later on, so be sure you've named it something meaningful where you can get back to it easily should you need it. This is what mine looks like.

For the next step we'll simplify the raster layer so that we are just showing where the sinkholes are. To do this I'll use the command in raster calculator Con("sinkhole01" > 0,1).

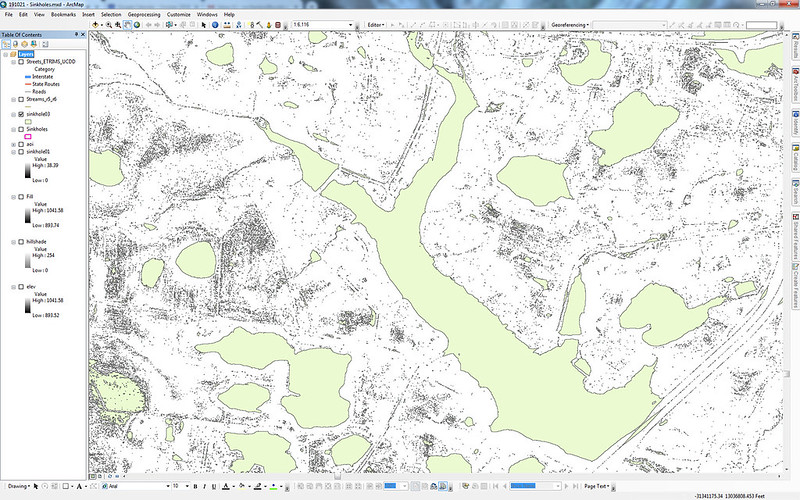
The resultant layer which shows the frightening number of sinkholes present should look like this.

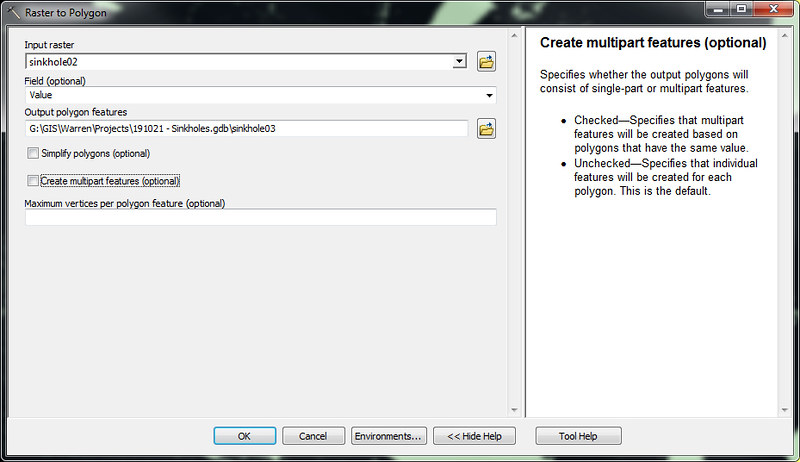
Clearly that's a ridiculous amount of data, most of which is probably noise, and/or simply isn't useful. We'll want to filter that. But first, let's convert the data to vector using the Raster to Polygon tool.
We end up with a polygon layer that looks like this.
Let's first filter out all the sinkholes that are less than 500 square feet.

That certainly removes a lot of smaller, trivial features. You should have something that looks like this.

There are still lots of false positives in this batch. We could manually edit them with as few as we have, or we could prepare ourselves for a larger dataset that cannot be easily manually filtered (that said, you're going to manually filter these no matter what). You'll note that natural sinkholes tend to be more round. Many features visible here are long and thin, or have a strait line associated with them. Some sinkholes have been bisected or crossed by roads, so we have to be careful to not remove real sinkholes. This is where it gets tricky.
Let's invoke a third party Add-in for ArcMap called Easy Calculate 10. It will help us easily calculate thickness - which is the ratio of area of the polygon to the area of a minimum bounding circle (which can be done in ArcMap, but is a multi-step process). As thickness approaches 1 the feature approaches a circular shape.

There's no telling what the right thickness is, but with a little play I came up with the below number. The goal is to not remove any real sinkholes.

As you can see there are still a number of false positives. Other filters can be used by collecting data from the original DEM or from sinkholes01 via Zonal Statistics, and applying filters as shown in the previous steps. Other filter possibilities could include depth (range in Zonal Statistics).
I'll choose to manually edit the sinkhole layer from this point. Clearly the highlighted features following roads and man made features like the pond won't make the cut.
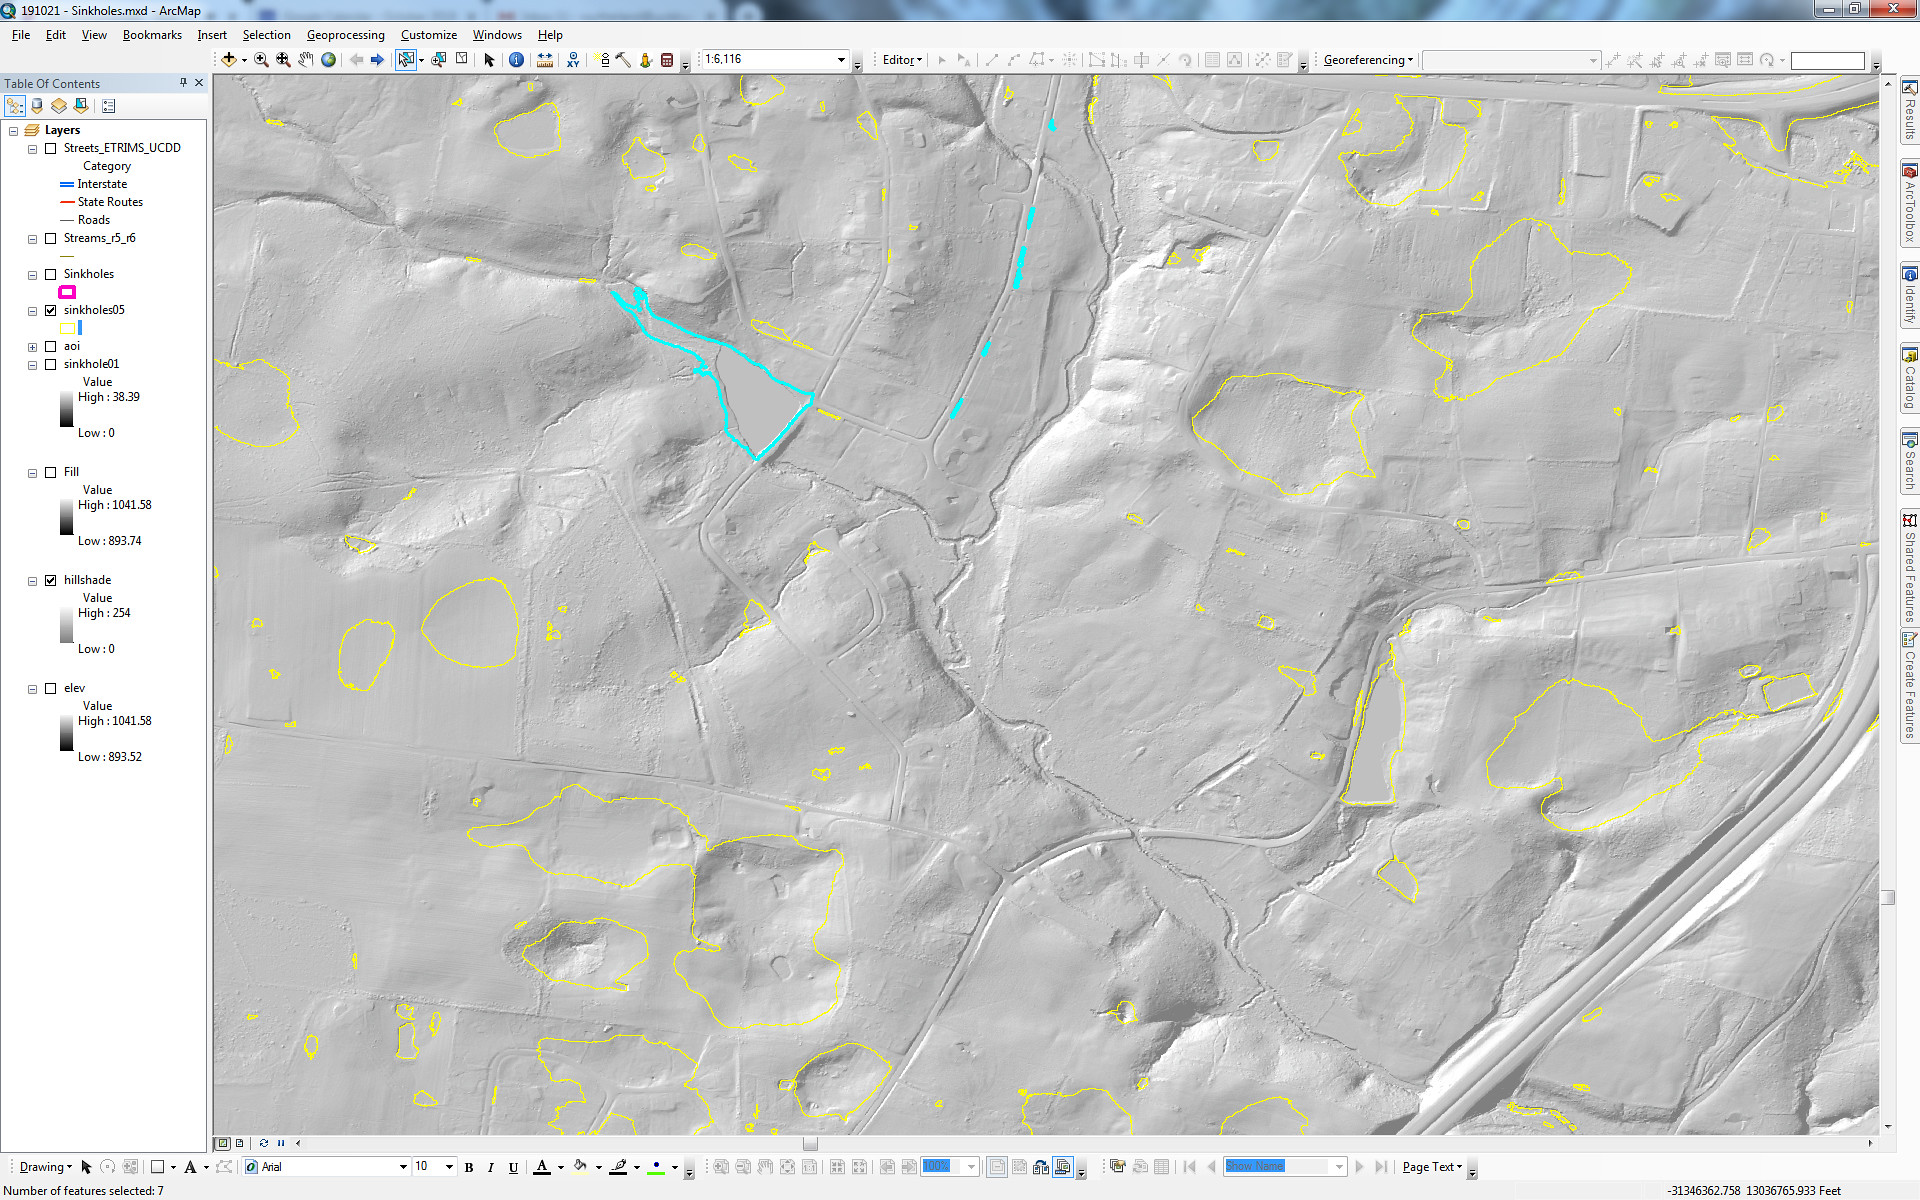
If you look carefully you can eliminate most of the features down to just the ones I have shown. Once you're here, you're ready to make a map.

Above language is borrowed and slightly modified from the Wikipedia page for Sinkholes.
In order to have a tutorial showing my methods for delineating sinkholes, I'll need to define some vocabulary. This vocabulary isn't intended to replace any existing definitions so much as to clarify the context in which I'll be using them.
Sinkhole: A closed depression through which water can only escape through the subsurface whose area is defined as the upper most closed elevation contour of the feature.
Swallet: The point where water disappears into the subsurface. This could also be a cave entrance.
For the purpose of this tutorial I have chosen a portion of Warren County, Tennessee. If you would like to follow along, I've created an area of interest feature class and have set it to be the extent which I will be working in. This will only allow my commands to affect that region, thus saving time by not processing the entire county. The area is centered at 35.688251, -85.818811 (nearly at the confluence of Oakland Branch and Willow Branch) and my scale is set to 1:8000. LiDAR elevation data can be found here under the folder WarrenCo_2015_16_DEM_by_Tiles.
Conceptually, it's pretty easy to figure out how to create a layer with sinkholes. It should be the difference between the DEM and a filled DEM, right? This is a good start, but as you will see, it requires some fine tuning.
First, let's look at what our end goal is. We want to produce a map that looks like this.
Let's begin by loading the elevation into the data frame and using the fill tool on it.
We will get a filled sink version of the DEM.
Setup your raster calculation to look like this and execute the command.
Your output will be the difference between the filled and regular DEM. This layer is useful for a few steps later on, so be sure you've named it something meaningful where you can get back to it easily should you need it. This is what mine looks like.
For the next step we'll simplify the raster layer so that we are just showing where the sinkholes are. To do this I'll use the command in raster calculator Con("sinkhole01" > 0,1).
The resultant layer which shows the frightening number of sinkholes present should look like this.
Clearly that's a ridiculous amount of data, most of which is probably noise, and/or simply isn't useful. We'll want to filter that. But first, let's convert the data to vector using the Raster to Polygon tool.
We end up with a polygon layer that looks like this.
Let's first filter out all the sinkholes that are less than 500 square feet.
That certainly removes a lot of smaller, trivial features. You should have something that looks like this.
There are still lots of false positives in this batch. We could manually edit them with as few as we have, or we could prepare ourselves for a larger dataset that cannot be easily manually filtered (that said, you're going to manually filter these no matter what). You'll note that natural sinkholes tend to be more round. Many features visible here are long and thin, or have a strait line associated with them. Some sinkholes have been bisected or crossed by roads, so we have to be careful to not remove real sinkholes. This is where it gets tricky.
Let's invoke a third party Add-in for ArcMap called Easy Calculate 10. It will help us easily calculate thickness - which is the ratio of area of the polygon to the area of a minimum bounding circle (which can be done in ArcMap, but is a multi-step process). As thickness approaches 1 the feature approaches a circular shape.
There's no telling what the right thickness is, but with a little play I came up with the below number. The goal is to not remove any real sinkholes.
As you can see there are still a number of false positives. Other filters can be used by collecting data from the original DEM or from sinkholes01 via Zonal Statistics, and applying filters as shown in the previous steps. Other filter possibilities could include depth (range in Zonal Statistics).
I'll choose to manually edit the sinkhole layer from this point. Clearly the highlighted features following roads and man made features like the pond won't make the cut.
If you look carefully you can eliminate most of the features down to just the ones I have shown. Once you're here, you're ready to make a map.


Comments