Coastline Paradox
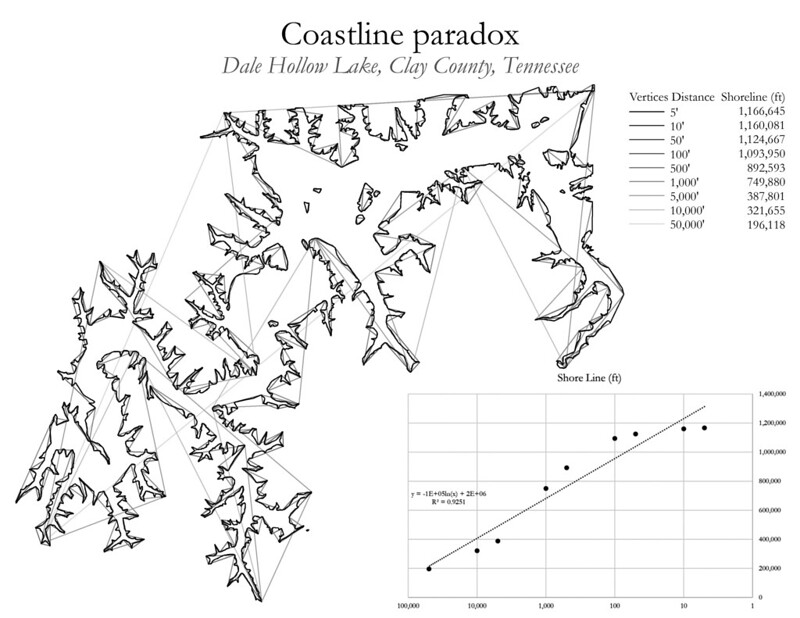
 A coastline or a shoreline is something that can only be measured with a measurable degree of accuracy. As the measure of accuracy changes, so does the length of the coastline / shoreline. In other words, if I take a yardstick, a ruler, and 30' length of rope to measure the shore, I get three different answers. Each is correct, when stated with what was used to make the measurement.
This is a counterintuitive outcome. Geographic Information Systems (GIS) should be able to quite easily measure the length of lines, right?
The problem lies within the analysis itself. I can only tell where the shoreline of Dale Hollow Lake is based on known described layers of data with measured limitations. If I artificially inflate those limitations (in this example, I'm increasing distance between vertices) and record the change in shoreline, one can see how the shoreline decreases as the measure of accuracy decreases (distance between vertices increases, shoreline decreases). Same is true in reverse. As my measures get more accurate (smaller vertices), the shoreline length will continue to increase. This could be done all the way down to Planck scale (I think) where its length begins to approach infinity. This is due to the fractal nature of reality.
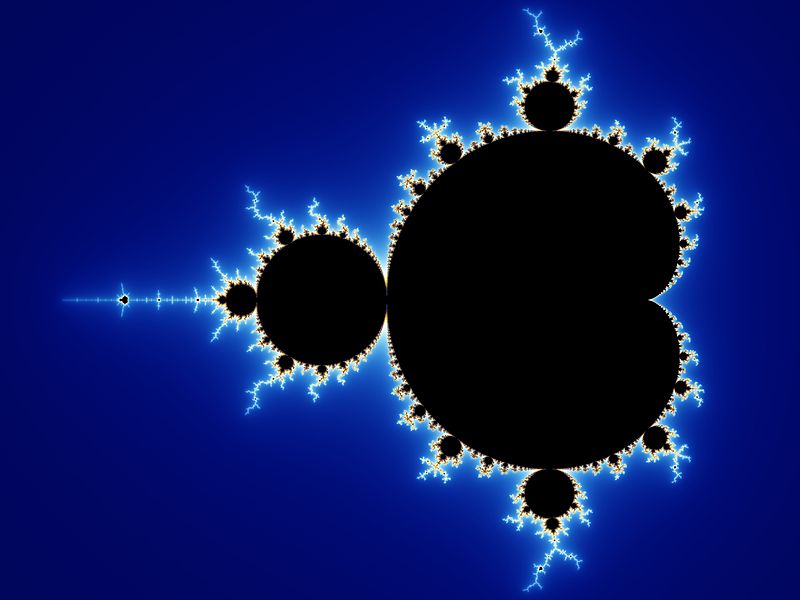
Look carefully at the above image. If you take the most detailed version of the lake and realize that if you continue to zoom in, you will continue to see that same pattern emerging as you peer ever closer. Mandelbrot created his famous fractal to describe this exact thing.
At Planck scale (and even well before) errors are introduced regarding the lakes elevation, which itself fluctuates, and is also subject to gravitational changes as well as aeolian alteration.
In short, one can only measure something with so much accuracy. How much is that? I have no idea.
For more reading: en.wikipedia.org/wiki/Coastline_paradox


Comments